Set up XDebug
XDebug is an extension for PHP that will help us with code debugging. We’ll use it combined with PHP Storm, which will provide us the step debugging feature, i.e. enable us to break during the code execution, inspect the variables in scope and evaluate code in the Console.
Install
sudo apt install php5.6-xdebug sudo apt install php7.1-xdebug sudo apt install php7.2-xdebug sudo apt install php7.3-xdebug sudo apt install php7.4-xdebug sudo apt install php8.0-xdebug sudo apt install php8.1-xdebug sudo apt install php8.2-xdebug
Configure PHP
The congifuration to enable the debugger may not work on Ubuntu when
added to php.ini. If debugging doesn’t work and the XDebug section
of phpinfo says that the Step Debugger is disabled, try adding the
configuration to the XDebug-specific configuration file. The file will
have a name similar to 20-xdebug.ini. This file should appear in the
printout of the command
php --ini
If there is no such configuration file, make sure that XDebug is enabled by running
sudo phpenmod -v ALL -s ALL xdebug
Configure XDebug on PhpStorm
Open
Preferences/Languages and Frameworks/PHP.Add your CLI interpreter here by opening CLI Interpreters window: inside it, click on plus sign and select Other Local…
Now you’ll need to adjust the PHP executable file path. If you’re unsure where your current PHP version executable file is, simply execute:
which phpand it will give you the path to the needed file.If everything is done correctly, PhpStorm should now list your PHP version, XDebug as debugger and PHP configuration file, looking something like this:
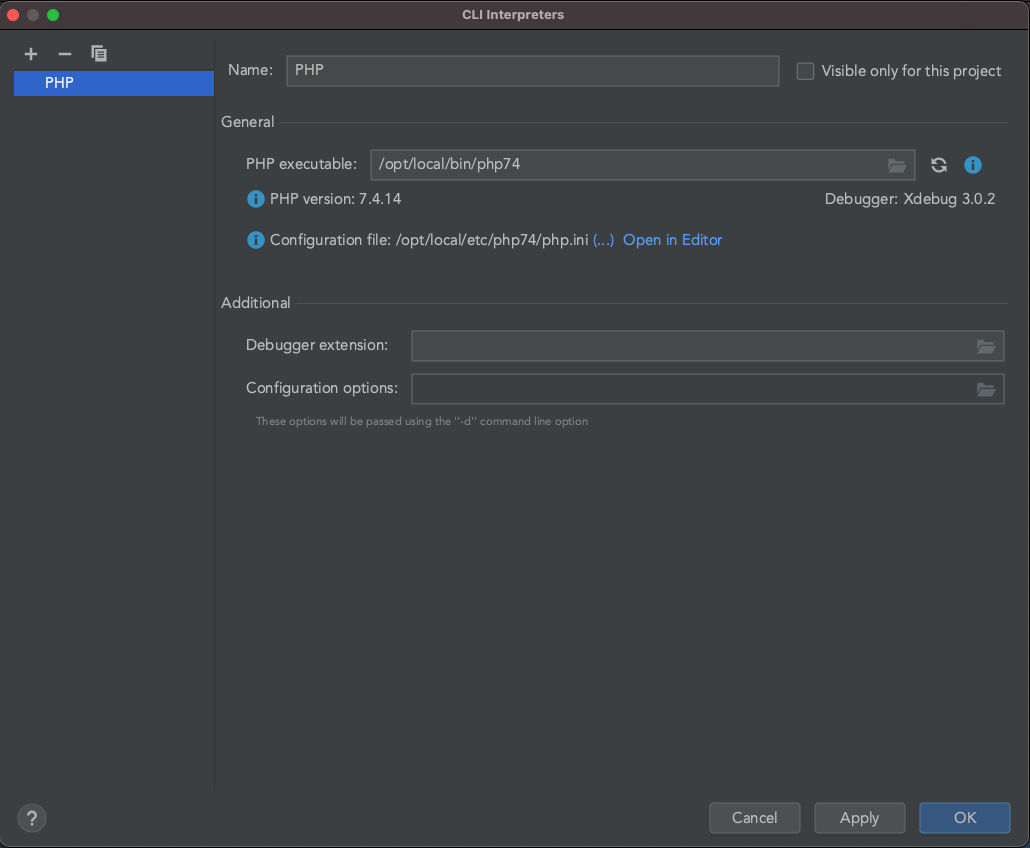
PhpStorm XDebug config
Skip this step if using XDebug version 2 or below (default port on these versions is 9000 so no adjustment is needed).
Next, we need to adjust debug port to 9003 which is the default XDebug port. Do so by going to
Preferences/Languages and Frameworks/PHP/Debugand setting Debug port under XDebug to 9003.In the end we just need to start listening to debug connections: enable
Run/Start Listening for PHP Debug Connectionsin the menu bar or use the shortcut button with the phone icon on the top right side of PhpStorm window.
Activating debugger
The easiest way for activating debugger is by installing XDebug Helper browser extensions. Choose your favorite browser, install and configure extension, and you’ll be able to start and stop debugging mode in your browser with just a few clicks. - XDebug Helper for Firefox - XDebug Helper for Chrome - XDebug Helper for Safari
Alternatively, if you want to activate the debugger manually, you’ll
need to add a trigger to your requests. Depending on what you need, add
one of the following: - XDEBUG_SESSION=session_name as an additional
GET (or POST) parameter if you want to initiate debugging on that single
request - XDEBUG_SESSION=session_name as a cookie: debugging will
now be initiated as long as that cookie is present
(value of session_name here is not important, you can set it to
whatever you like)
Test
Finally, choose a request you want to debug, set a breakpoint in PhpStorm on the line in your code you’re sure that your request will hit and fire away. If everything went well, PhpStorm should have opened debug window and now you have complete insight in what is happening in your code.
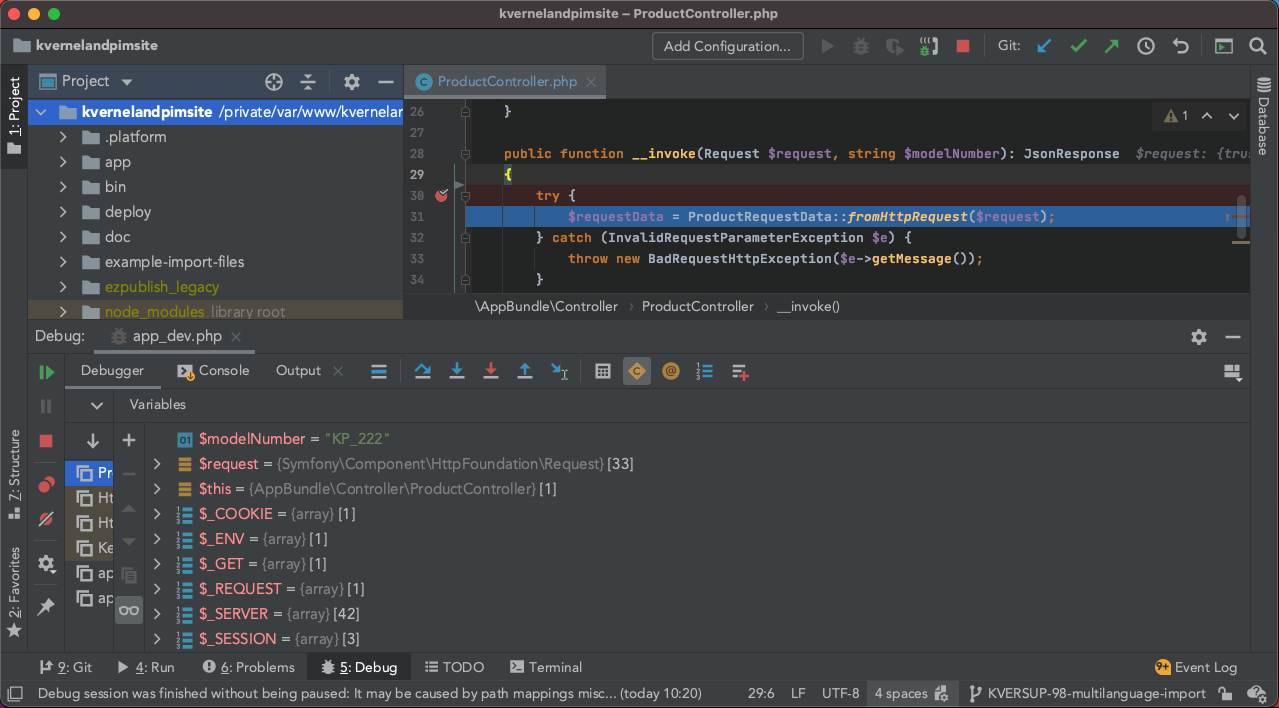
PhpStorm debug window
Easily enable and disable XDebug
To prevent XDebug slowing down our requests when we are not debugging, it would be wise to disable it whenever we’re not using it. That’s why we’ll guide you to write a few shell scripts and aliases with which XDebug enabling or disabling will be a matter of entering a three-letter command in terminal.
What we’ll want to do is rename xdebug.ini file so that it can’t be
found and hence won’t be loaded, and after that reload PHP-FPM server.
Again, as an example, everything will be done for PHP 7.4 so don’t
forget to adjust commands to your version.
Ubuntu configuration
To enable XDebug on all PHP versions and SAPIs:
sudo phpenmod -v ALL -s ALL xdebug
To disable XDebug on all PHP versions and SAPIs:
sudo phpdismod -v ALL -s ALL xdebug
And reload fpm after that:
sudo systemctl reload php7.4-fpm